E-commerce survey: girls are buying more fashion items than boys
The e-commerce survey “Consumer Behavior Online 2018” has just been launched. Because this study exposes several curiosities about Brazilian e-commerce consumers.
Certainly, one of these curiosities is the one that reveals that girls buy a lot more fashion and baby items while boys buy a lot more drinks and computer products. That is, there is a supremacy of them and of them in the mentioned categories.
By viewing this research, you can find out which products are most frequently purchased by certain types of people, for example. As you can see, this is a great help in creating a winning product mix .
It is worth remembering that this report was produced by Anymarket, Neoassist and Vindi according to access statistics from more than 35 million consumers registered in the Social Miner engagement platform and in the databases of the other companies mentioned above. The numbers basically cover the period from January to December 2018.
E-commerce research shows that girls buy fashion, and boys buy computers
According to the study:
• 92,58% of men and 07,42% of women buy computer products
• 70,12% of men and 29,88% of women buy drinks
• 65,54% of men and 34,46% of women buy electronics
• 47,82% of men and 52,18% of women shop in multi-categories
• 47,42% of men and 52,58% of women buy in bookstores
• 46,01% of men and 53,99% of women buy home appliances
• 42,65% of men and 57,35% of women buy trips and stays
• 27,52% of men and 72,48% of women buy food
• 25,63% of men and 74,37% of women buy pet products
• 22,92% of men and 77,08% of women buy furniture
• 16,37% of men and 83,63% of women buy beauty products
• 10,77% of men and 89,23% of women buy fashion products
• 07,59% of men and 92,41% of women buy baby products
Finally, these data reveal not only that women have been buying more from e-commerce. They point out, above all, a hegemony of women in the purchase of fashion products and baby items, and also a hegemony of men in the purchase of beverages and computer products.
Average Ticket by Category
The Average Ticket by category in the period, according to this e-commerce survey, was:
• R$ 1.000,00 for electronics
• R$ 684,33 for multicategories
• R$ 677,50 for home appliances
• R$ 481,00 for IT
• BRL 319,60 for fashion
• BRL 207,67 for drinks
• R$ 196,00 for furniture
• BRL 156,67 for pet
• R$ 150,00 for babies
• R$ 147,00 for bookstore
• R$ 143,20 for beauty and health
Therefore, adding up the total of all categories and dividing it by 11, we have an overall Average Ticket of BRL 378,45.
Mobile and desktop sales volume
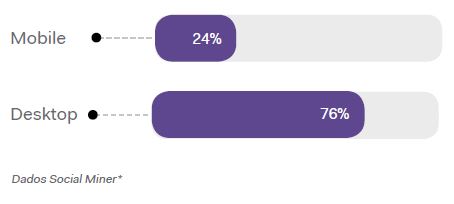
E-commerce survey: sales volume via mobile was 24% in 2018
The study also indicates that desktop commerce accounted for 76% of e-commerce sales in 2018. Mobile stores , on the other hand, held 24% of the online market during that period.
Here, mainly, computer products were highlighted. Exactly 83,54% of them were sold via desktop and only 16,46% were sold via mobile technologies.
Furthermore, the category most sold via mobile was furniture, with 46,70% of sales made via smartphones and tablets and 53,30% of sales made via desktop computers.
More data from Anymarket e-commerce survey
This Anymarket e-commerce survey exposes statistics on:
• Variation in the volume of visits
• Variation in sales volume
• Sales by region
• Sales by state
• Sales by category
• Sales by category vs gender
• Sales by category vs region
• Average price by category
• Sales on marketplaces
• Mobile vs desktop sales volume
• Mobile vs desktop sales volume by category
• Approved transactions vs payment method
• Approved transactions vs installment
• Impact of the Average Ticket on installment payments
• Transactions by brand
• Calls by service channel
• Analysis of business dates
To download the complete document, go to the “ Consumer Behavior Report ” page and fill in the fields. It's worth taking a look at these numbers. This way, you'll know who is buying what, and that can help you optimize your product mix.